Saving the coastline with an AI powered dashboard
- Google X - Tidal X AI

- Mar 30
- 4 min read
Updated: Apr 5
ROLE
UI Design Lead
DURATION
3 Months
SERVICES
User interface, Design systems, Branding & Identity, Project Management, UX, Task flows, Wireframes, Mockups, Prototypes

CHALLENGE
Fish farming operations managers working offshore had no line of sight below the water's surface leaving critical decisions about feed, yield, and pest control to guesswork.
STRATEGY
I led UI design for an ML-powered operations dashboard, accelerating the team from disconnected wireframes to high-fidelity product
IMPACT
Delivered a testable MVP for Norwegian fish farming partner Mowi, laying the foundation for sustainable, data-driven aquaculture operations.
CHALLENGE
The ocean feeds billions — and the data was invisible
Close to 40% of the global population lives within 60 miles of a coastline. The ocean is a vital source of oxygen, food, and livelihood for billions of people worldwide. Yet despite its importance, the aquaculture industry has been slow to modernize — and the consequences are significant. Pollution, acidification, and unsustainable fishing and farming practices are damaging ecosystems from tropical reefs to the Arctic.
Tidal, a moonshot project within Google X, was building a system of underwater cameras, sensors, and machine learning tools to change that. The vision was compelling: give fish farming operations managers real-time, actionable data — biomass levels, sea lice prevalence, feed optimization signals — so they could run more sustainable, productive operations from offshore barges.
The problem was that the vision existed almost entirely in disconnected graphs and other outputs of raw data. Contractual deadlines with Mowi, their Norwegian aquaculture partner, were closing in. The fish farmers expected a usable MVP to test. The team had neither the interface nor the process to deliver one.


STRATEGY
Establishing order before designing anything
Before a single screen could be designed, the team needed a functioning design operation. Work was being tracked out of a Google Doc, and widely-used project management tools like Asana were prohibited under Google X's governance policies. The result was a growing backlog, misalignment with stakeholders, and wasted time at every handoff.
“I don’t know how we’re going to finish all this in time” a Tidal product owner was heard lamenting.
I approached this as a design problem in its own right. Working within the constraints of available Google software, I prototyped a kanban system in Google Sheets as an immediate stopgap — then transitioned the team to Buganizer, Google's internal ticketing tool, with a kanban add-on. The team used the new system to assign, track, and measure design tasks and team velocity across multiple workstreams. Throughput improved measurably, and we had breathing room at the end to design features earmarked for the next phase like hardware controllers.

Advocating for users without direct access to them
Planning qualitative research for a multibrand audience meant navigating a significant number of variables: age, location, shopper type, product category, and shopping mission all had to be accounted for. We designed a distribution heat map to ensure the participant pool represented the full range of Nike's relevant shopper segments, then planned and executed 21 in-depth interviews of 90 minutes each.
As a TVC (Temp/Vendor/Contractor) within Google X, I operated under strict access limitations. User research files were locked behind a separate NDA with Mowi, which meant I couldn't conduct or review discovery interviews directly.
Rather than accept that constraint and design in a vacuum, I advocated for a proxy research approach. I assembled a structured list of questions and worked with product managers to extract relevant insights from the locked files. Any remaining gaps were filled through interviews with internal subject matter experts and data scientists. Merging those findings with product requirements documents gave me — for the first time — a clear, coherent picture of how the ML hardware and software orchestrated together, and what the operations managers actually needed to make decisions on the barge.

Building a design system that moved at the speed of the deadline
With contractual pressure bearing down, I made a deliberate build-vs-borrow decision on the design system. Rather than designing components from scratch, I used Material Design's dark theme as a structural foundation — adapting the color system, typography, and component library to reflect Tidal's brand and the specific demands of the context.
The context mattered enormously here. Operations managers work in low-light environments on offshore barges, reading data-heavy dashboards in conditions that have nothing in common with a standard office setup. Accessibility wasn't a compliance checkbox — it was a core functional requirement that shaped every color, contrast, and type decision in the system.

From flows to high-fidelity without stopping at wireframes
With the design system established, I worked alongside a UX contractor to remap existing user flows and develop new ones. The system gave us enough of a shared language that we could skip the wireframe phase entirely — moving directly from whiteboard sketches, aligned in structured "design jam" sessions with product owners, straight to high-fidelity mockups.
This wasn't a shortcut. It was a deliberate efficiency enabled by having the right foundation in place first.
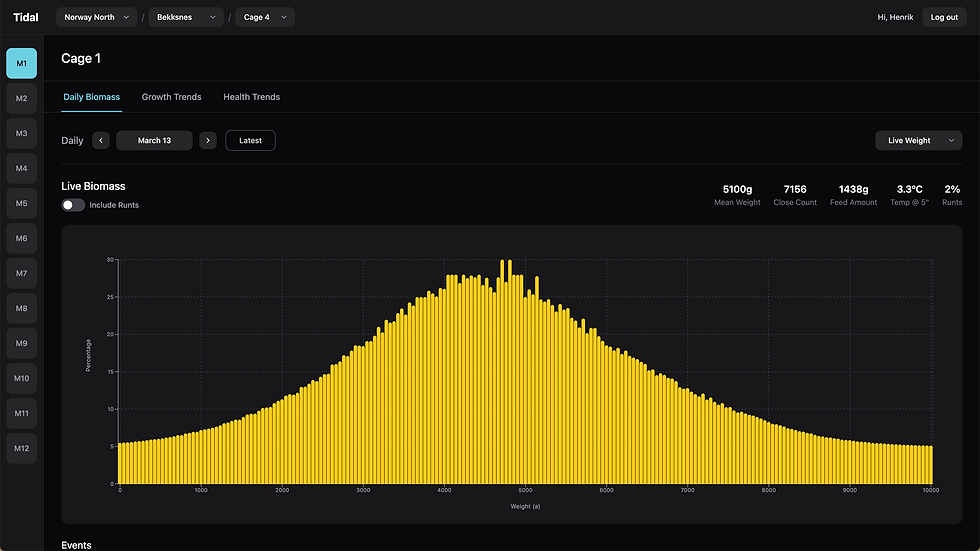
The MVP dashboard surfaced two primary data points: biomass levels and sea lice prevalence. By mapping peaks and valleys in that data to an event-based notification system, operations managers gained something they'd never had before — timely, granular information tied directly to decisions they needed to make every day: how much to feed, when to intervene, how to grow operations sustainably without waste.
RESULTS

Graduating from secret project to public company
Project Koi completes the last stage of X Moonshot Factory’s internal incubator process and is introduced to the world as Tidal (similar to Waymo)

“Veldig bra” Feedback from Users
Fish farming managers (via partnership with Norway’s Mowi) provide feedback commenting how easy and intuitive it is using the Tidal dashboard
Saving the coastline through optimization and AI
Mowi managers report under 3% error in biomass estimates at harvest time and a reduction in treatment numbers by up to 25% in some areas


